Annual Greenhouse Gas Protocol (GHG) of Babol Noshirvani University of Technology 2021-2022

In The Name of God
Greenhouse Gas Protocol Scope 2 Report for Babol Noshirvani University of Technology (BNUT):
Assessment period: March 2021-March 2022 (Fiscal year)
Table of contents
- Introduction
- What is scope 2
- Assessment summery for our university
- Annual activity data
Introduction
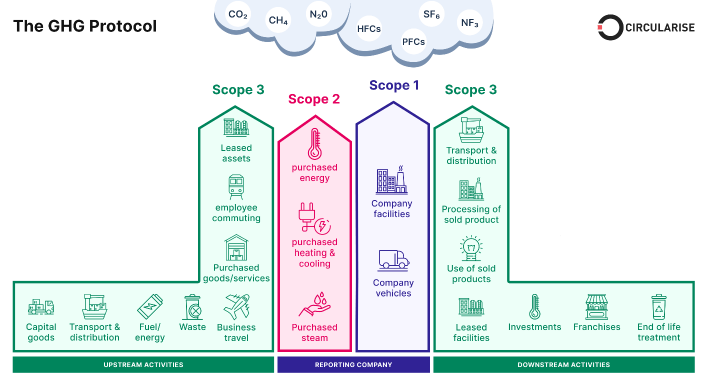
A greenhouse gas (GHG) emissions assessment quantifies the total greenhouse gases produced directly and indirectly from a business or organization’s activities. Also known as a carbon footprint, it is an essential tool, providing your business with a basis for understanding and managing its climate change impacts. A GHG assessment quantifies all seven Kyoto greenhouse gases where applicable and is measured in units of carbon dioxide equivalence, or CO2. The seven Kyoto gases are carbon dioxide (CO2), methane (CH4), nitrous oxide (N2 O), hydrofluorocarbons (HFCs), nitrogen trifluoride (NF3), Sulphur hexafluoride (SF6) and perfluorocarbons (PFCs).
Scope 2
Scope 2 emissions are indirect emissions from the generation of purchased electricity, steam, heat, or cooling from the utility provider. The University does not purchase any steam, heat, or cooling but does buy all electricity on a Renewable Energy Guarantee of Origin (REGO) backed tariff. This electricity is provided through the grid. As a standard from the Higher Education Statistics Agency (HESA) Estates Management Record (EMR), reporting electricity transported through the grid is accounted for at a grid factor rate. Additional electricity is produced by onsite PV. The operation of PV produces zero emissions and has been accounted for as such in this scope. However, emissions from the production of the equipment are accounted for in Scope 3. In this report, the annual effective carbon emissions from electricity consumption have been calculated. The seasonal average emissions from electricity consumption from the grid throughout a day have also been calculated so that recommendations on electricity consumption can be made relative to the carbon intensity of the grid.
assessment summery for our university
Absolute GHG emissions will vary over time and often correspond to the expansion or contraction of an organization. It is useful therefore to use reporting metrics that take these effects into account and monitor relative GHG emissions intensity. A common emissions intensity metric is tones of CO2 e per full time equivalent. This has been calculated, along with other relevant metrics, as follows:
CO2 (electricity)
=(electricity usage per year (kWh))/1000)×0,84
=1627374 kWh1000×0,84
= 1367 metric tons
CO2 (bus)
=((number of shuttle bus in university × total trips for shuttle bus service each day ×approximate travel distance of vehicle each day inside campus only KM ×240)/100)×0,01
=(0/100)×0,01
= 0 metric tons
CO2 (cars)
=((number of cars entering university × 2 × approximate travel distance of vehicle each day inside campus only KM ×240)/100)×0,02
=(140 ×2 ×0.2 ×240)/100)×0,02
= 2.688 metric tons
CO2 (motorcycle)
=((number of motorcycle entering university × 2 × approximate travel distance of vehicle each day inside campus only KM ×240)/100)×0,01
=((10 ×2 ×0.2 ×240)/100)×0,01
= 0.096 metric tons
Annual activity data
CO2 (total)
= 1367 + 0 + 2.688 + 0.096
= 1369.784 metric tons
Download here: Attachment
Your Comment :